How I improved the loading speed of this page by 20%.
Since I developed this page I knew there were certain performance issues and that at some point I had to fix it, that point was yesterday.
To know what to improve you have to measure
Using Google PageSpeed Insights, a Google Chrome tool that reports on the performance of a page on mobile and desktop devices, and offers suggestions on how that page can be improved.
Running Google PageSpeed Insights on this page we immediately noticed that it has some major performance issues, let's take a look at the results.
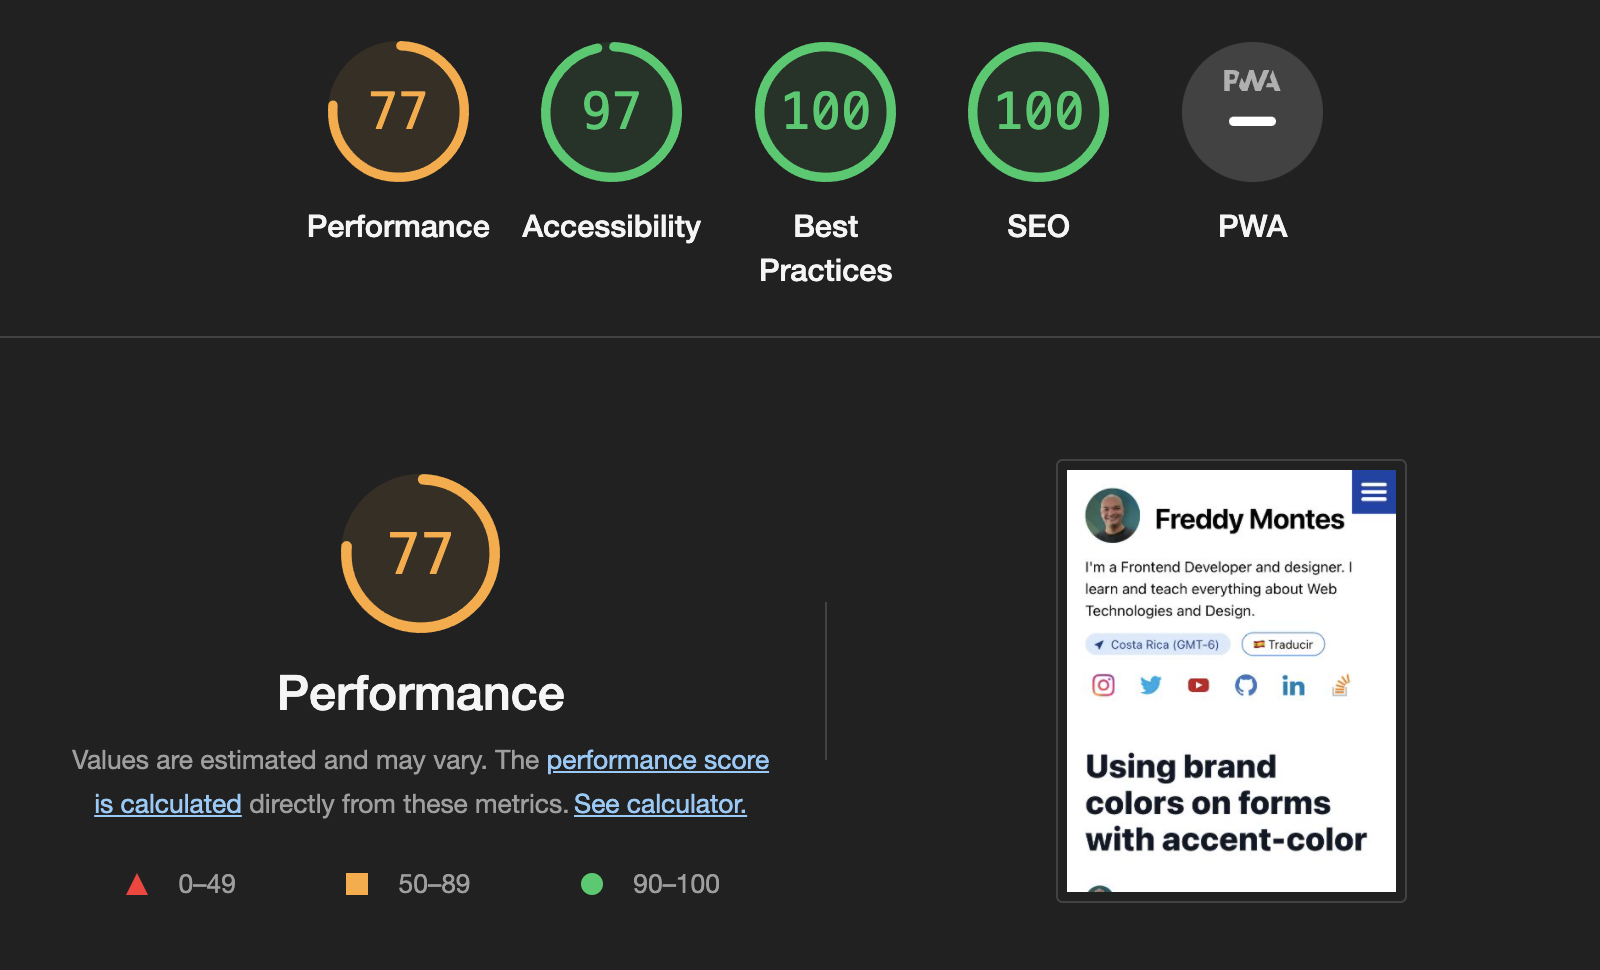
A 77 performance is not a good result (that's why it's in yellow 😂) and this is precisely what I want to fix, but to know how to fix it I need to take a closer look.
Taking a closer look at the metrics.
In the Google PageSpeed Insights report I could see in more detail what are the problems that the page has for the performance to be at just 77 out of 100.
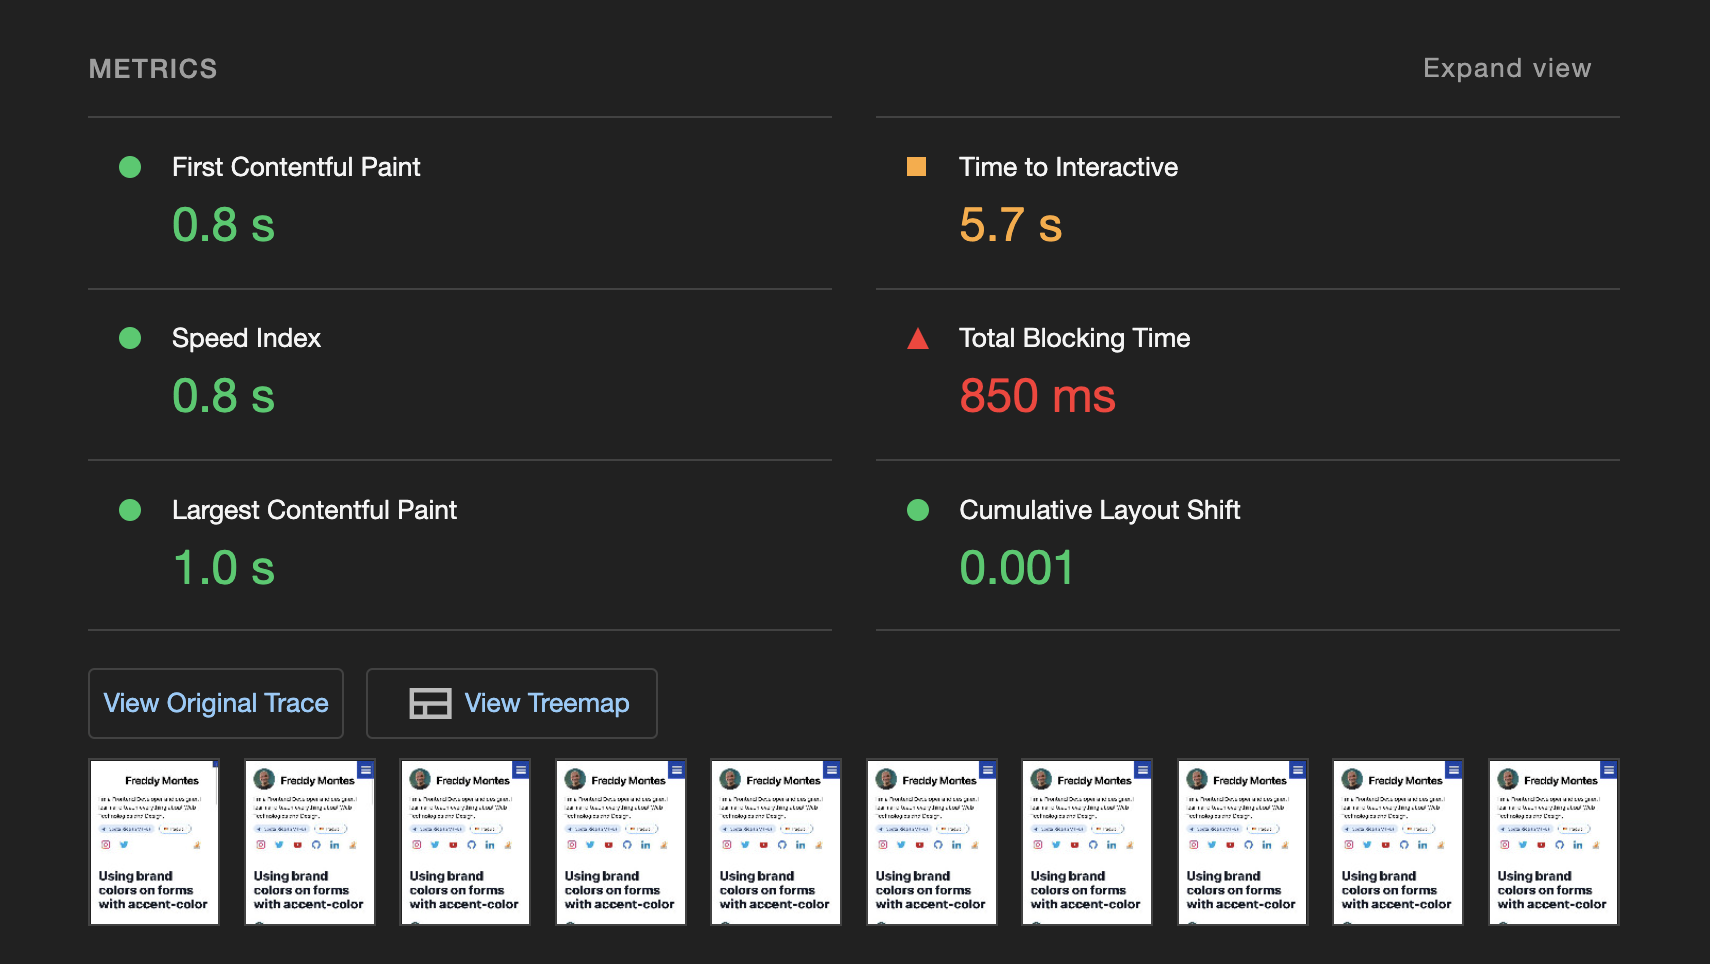
In the detail of the metrics I could see that the Time to Interact and Total Blocking Time were very high, 5.7 seconds and 850 milliseconds respectively.
In the following image we can see that there are two metrics that are wrong (yellow and red):
Time to Interact
The time to interact measures the amount of time it takes for the page to become fully interactive. And according to Google's standards:
- 🟩 Between 0 and 3.8 seconds is considered fast (what we want).
- 🟨 Between 3.9 and 7.3 seconds is considered moderately slow.
- 🟥 More than 7.3 seconds is considered slow.
Total Blocking Time
The total blocking time measures the total amount of time the main thread spends blocking long enough to cause the user to be unable to interact with the page.
It makes this measurement between when the first elements of the page are "painted" (First Contentful Paint) and the Time to interact.
- 🟩 Between 0-200 milliseconds is considered fast (what we want).
- 🟨 Between 200-600 milliseconds is considered moderately slow.
- 🟥 More than 600 milliseconds is considered slow.
How do I fix that?
Google PageSpeed Insights gives me recommendations to improve each of the points that are wrong with my page.
For Time to Interact it tells me I need to:
- Minimize main thread work.
- Reduce JavaScript execution time
And for Total Blocking Time it recommends me that I have to
- Check if I have unnecessary JavaScript loading, parsing or execution
- Inefficient JavaScript statements
Already with this information I can know or suspect that on this page I have too much JavaScript running or that I have a lot of inefficient JavaScript code.
I become a detective
I start to think that I have on this page that requires a lot of JavaScript running. At first I can't think of anything because it's a blog page, it's just text and images, no big deal, but also this page is statically generated with Next.js.
Using the Performance tab
The performance tab of the Web Inspector allows me to evaluate how the JavaScript executes when my page loads. I open the Web Inspector go to the Performance tab and click on "Reload".
In the result I can immediately see that I have a "Long tasks".
A long task is JavaScript code that monopolizes the main thread for long periods of time, causing the user interface to freeze.
Source: Are long JavaScript tasks delaying your Time to Interactive?.
Then in the Bottom-Up tab which is used to see which activities directly take the longest time overall I can see that the code in the prism-core.js file takes the longest time to execute.
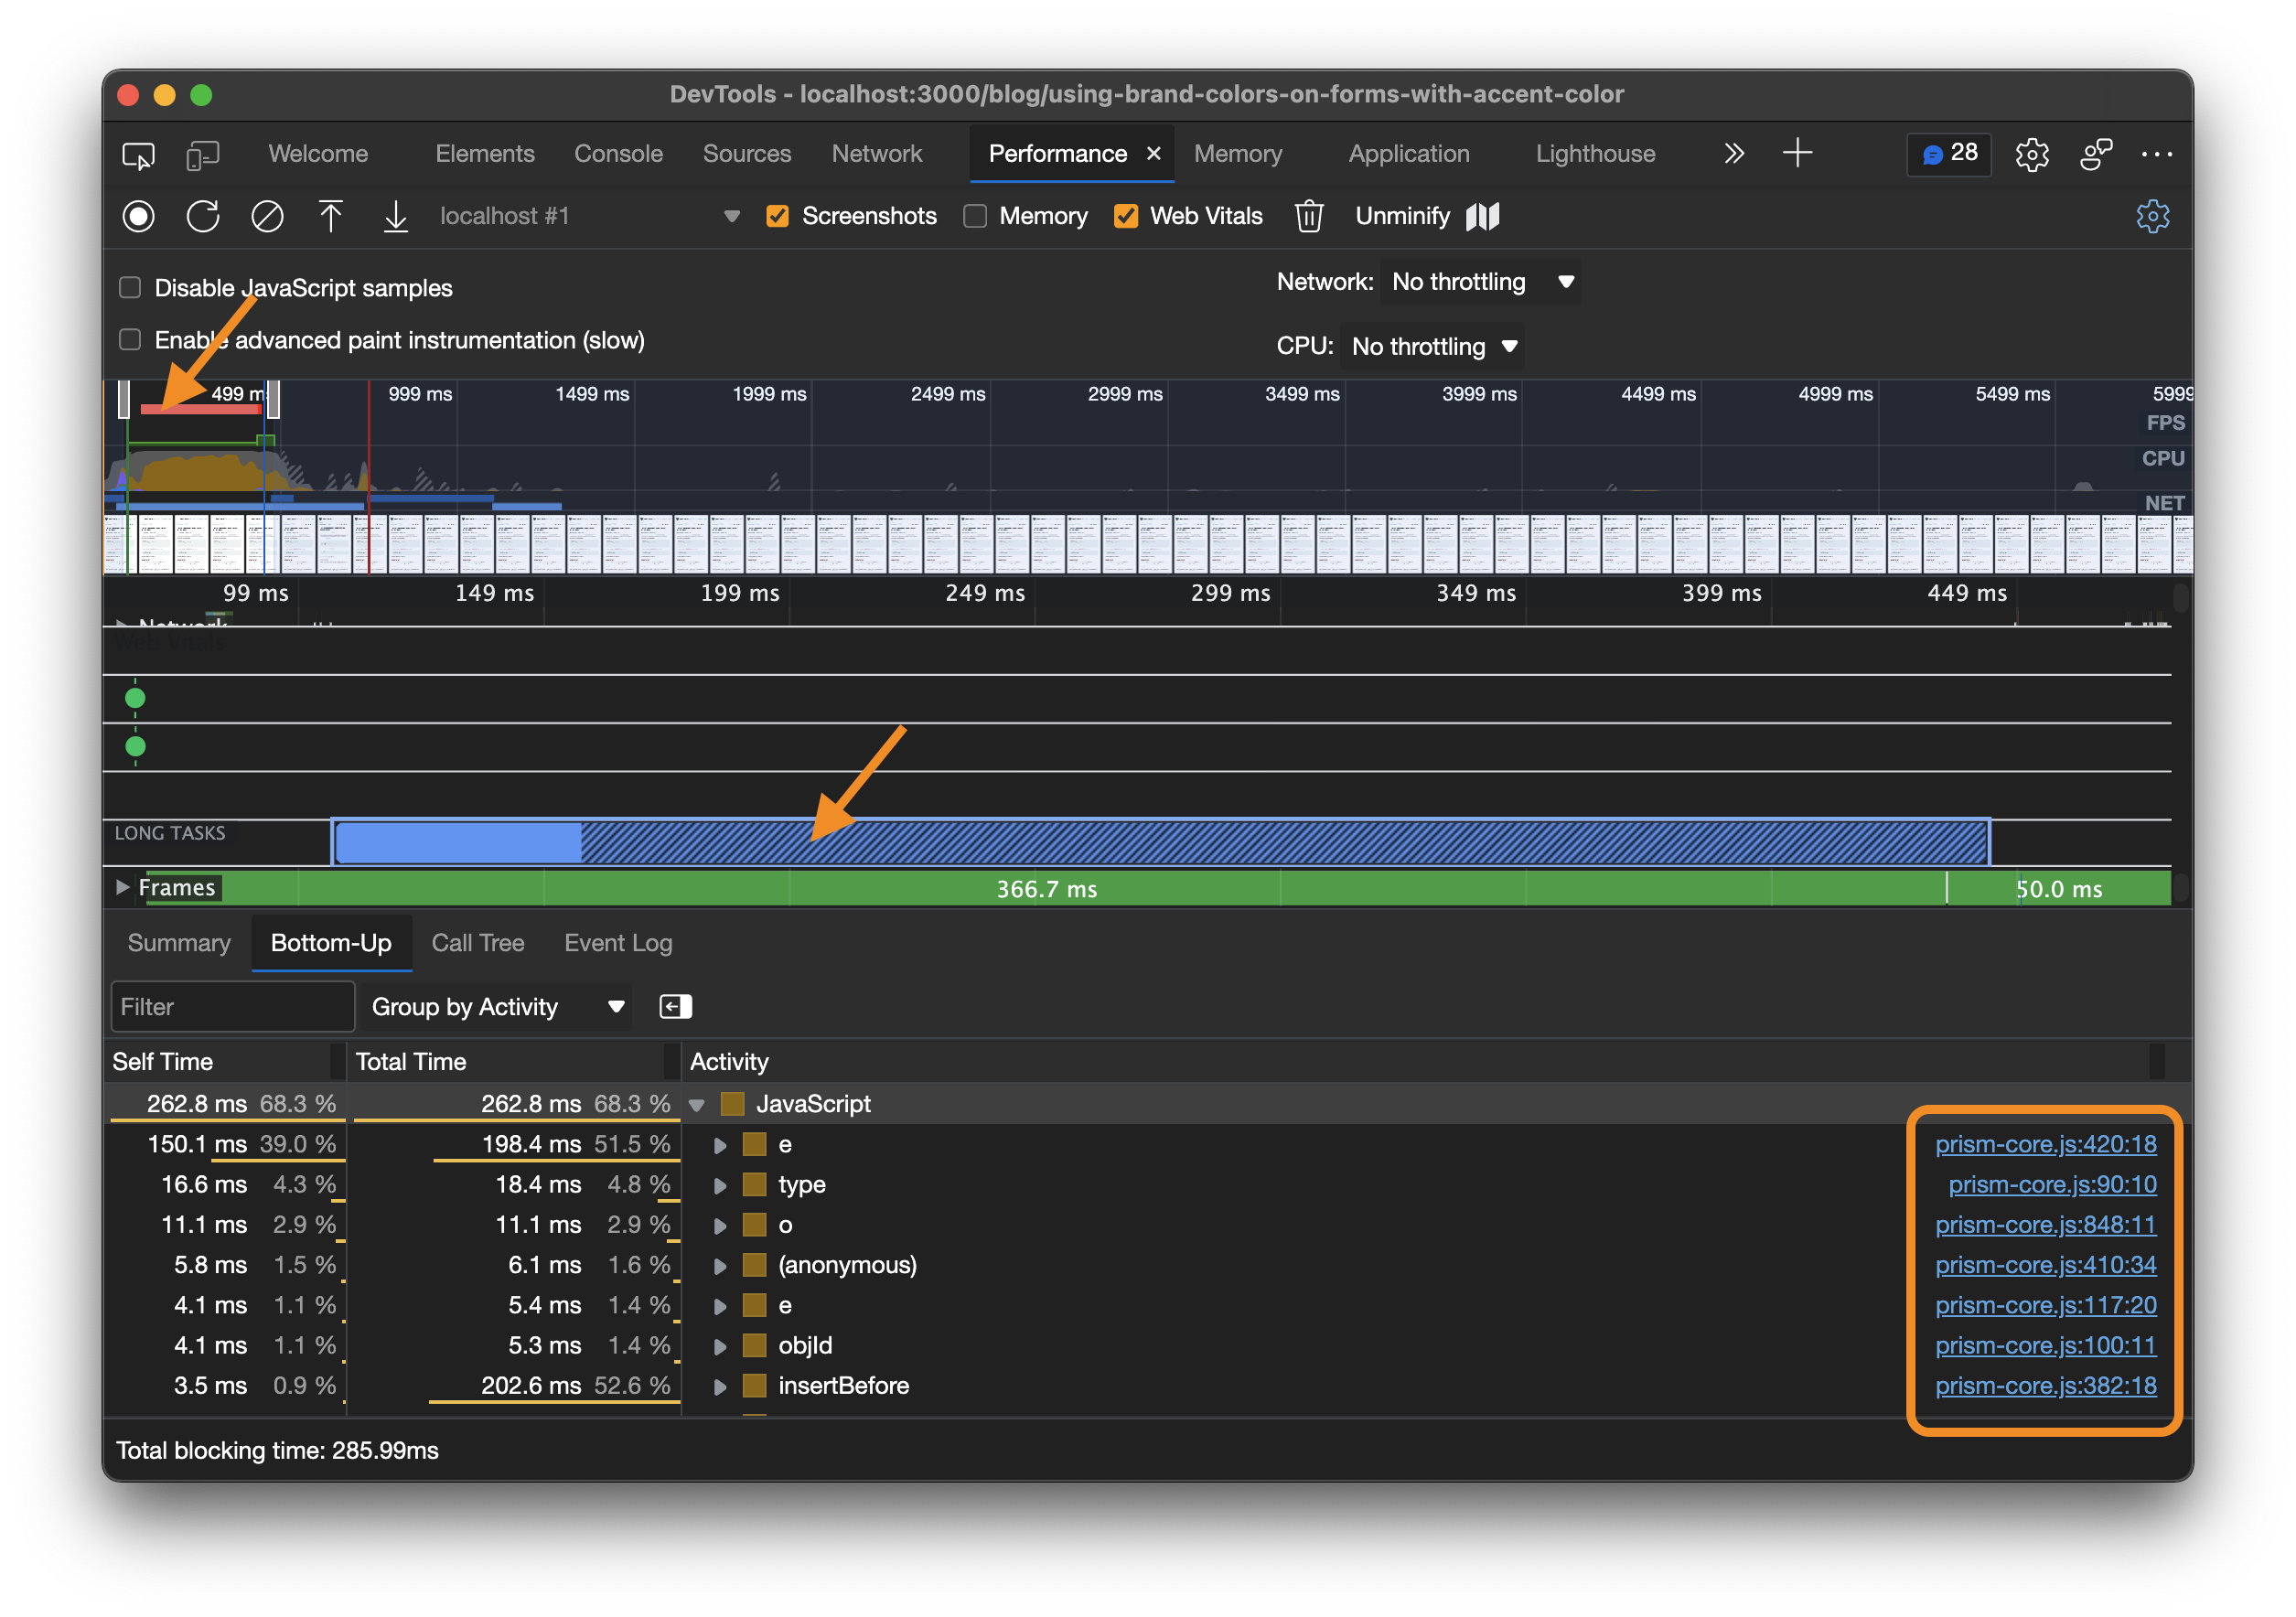
In the first arrow above I can see a red bar in the timeline, that indicates a "Long Task" and if I approach the Long Tasks row I can see it more clearly.
What is prism?
Prism is a library that is used to do syntax highlighting of the code examples in my blog posts. Now I have to get who uses it.
Finding the culprit
- *I don't use Prism directly, so I probably have a library that does. What I did was to go inside the code of the page and start checking inside the files I'm importing to see if I get something strange and....
I got it, react-syntax-highlighter is the library I'm using to do the syntax hightlighting of the code blocks and underneath it uses prims.

In the code of the file in VSCode and thanks to the Import Cost extension I can see how the react-syntax-highlighter library is very heavy.
As Import Cost shows us, it weighs 187kb gzipped, that's too much. Así que tiene sentido que esta librería sea el problema. Import Cost es una extensión de VsCode que te permite identificar imports en tus archivos de JavaScript o Typescript que sean muy pesados.
Is really guilty?
So far react-syntax-highlighter looks good suspicious, but until I test I can't tell if it's really the culprit.
As I said, this library is only for rendering code blocks, so I can remove it and render with the blocks with <pre> and <code> to test. Los bloques de código se van a ver sin syntax hightlight, pero es únicamente para probar.
Again I run Google Page Insights on the page and....

Indeed, react-syntax-highlighter is the culprit of, as Luis Miguel from Mexico sings, all my anguish and all my brokenness.
Looking for the replacement
This is a technical blog so it's going to have a lot of code examples, I can't just remove react-syntax-highlighter, I need an alternative.
Creating my problem library from scratch
Although this is an alternative, not a good one, formatting code to make it look good is a very common task because there must already exist a lot of libraries that do this, writing one from scratch is a waste of time.
refractor
It is a lightweight, robust, elegant and elegant code formatting library that uses Prims underneath, which is the same library that used react-syntax-highlighter. The way it works is pretty straightforward:
- Import the library
- The highlight method is called, passing the code and the language.
- It gives us a json object with the format
The json object looks like this:
But I don't need a json I need to convert that into HTML. For that I use another library called hast-util-to-html.
This will give me the HTML
And this HTML is perfect because it has the same classes that I already have to style the code block and this is a result of both refractor and react-syntax-highlighter libraries using Prism (yet another library) underneath.
Creating my new component
To encapsulate all this the best thing to do is to create a React component that receives the code and the language and formats everything, so I can reuse it as many times as necessary. It's a pretty simple component and its code looks like this:
dangerouslySetInnerHTML is React's replacement for using innerHTML in the browser DOM. You can read more about it in the React. documentation
Using the component
Finally what I have left is to use my new component to render the code blocks:
Did it work?
Google Page Insights
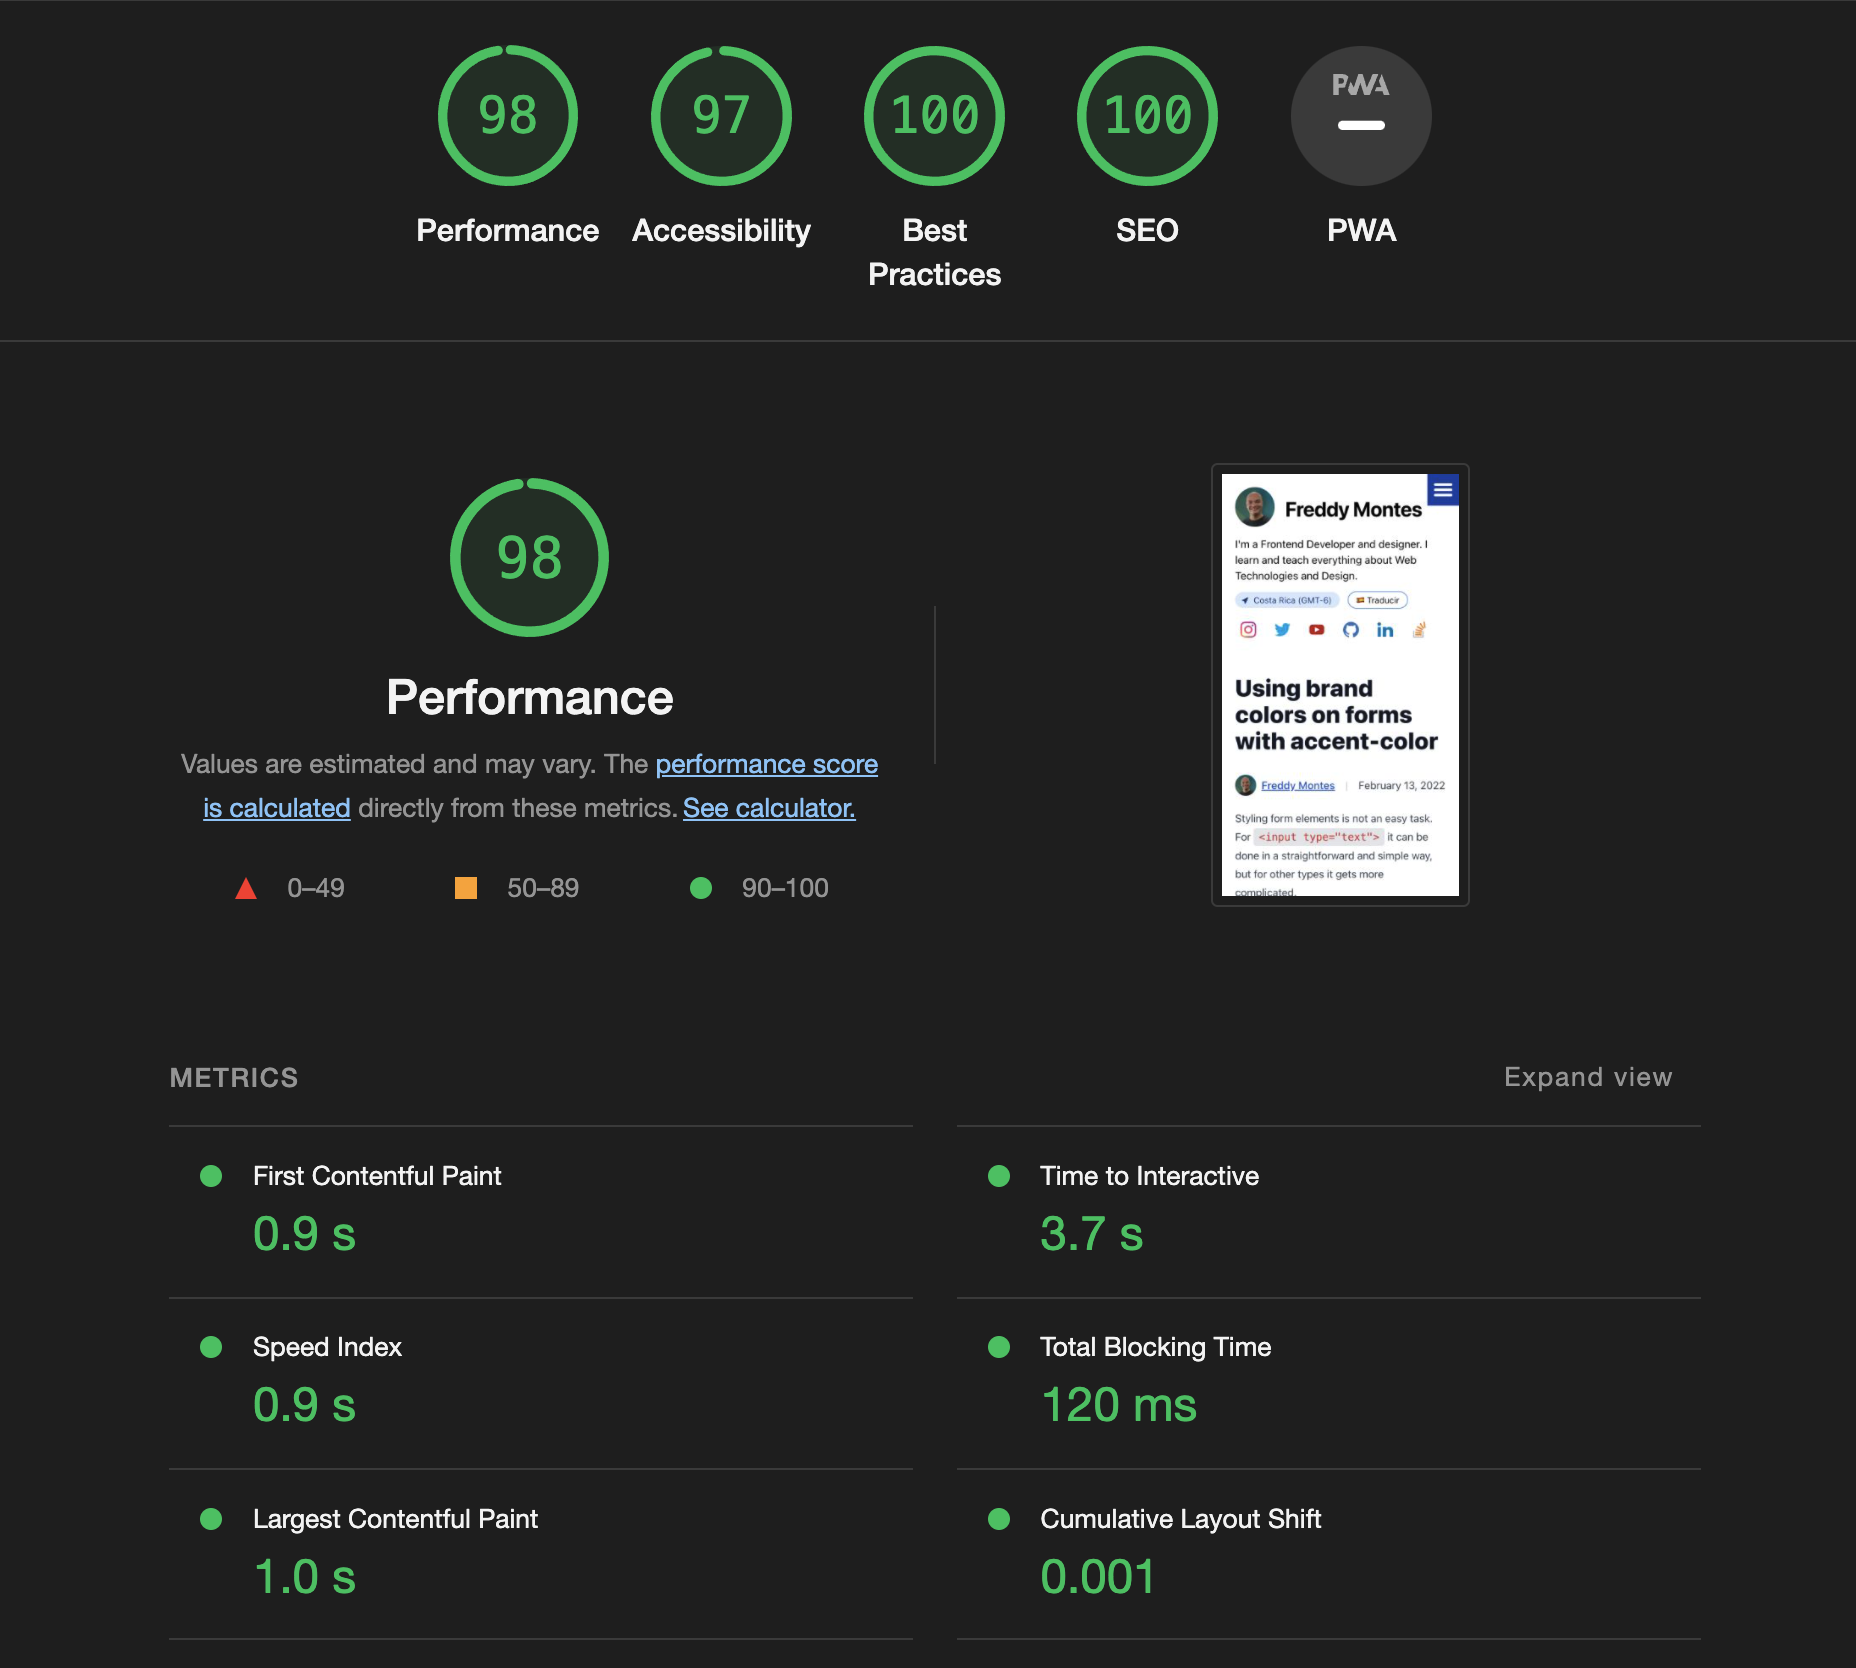
Now that I have the solution ready and running, I just need to make sure that the performance has improved, I run again Google Page Insights.
Performance Tab
Finally I run again the "runtime performance analysis" in the Performance tab....
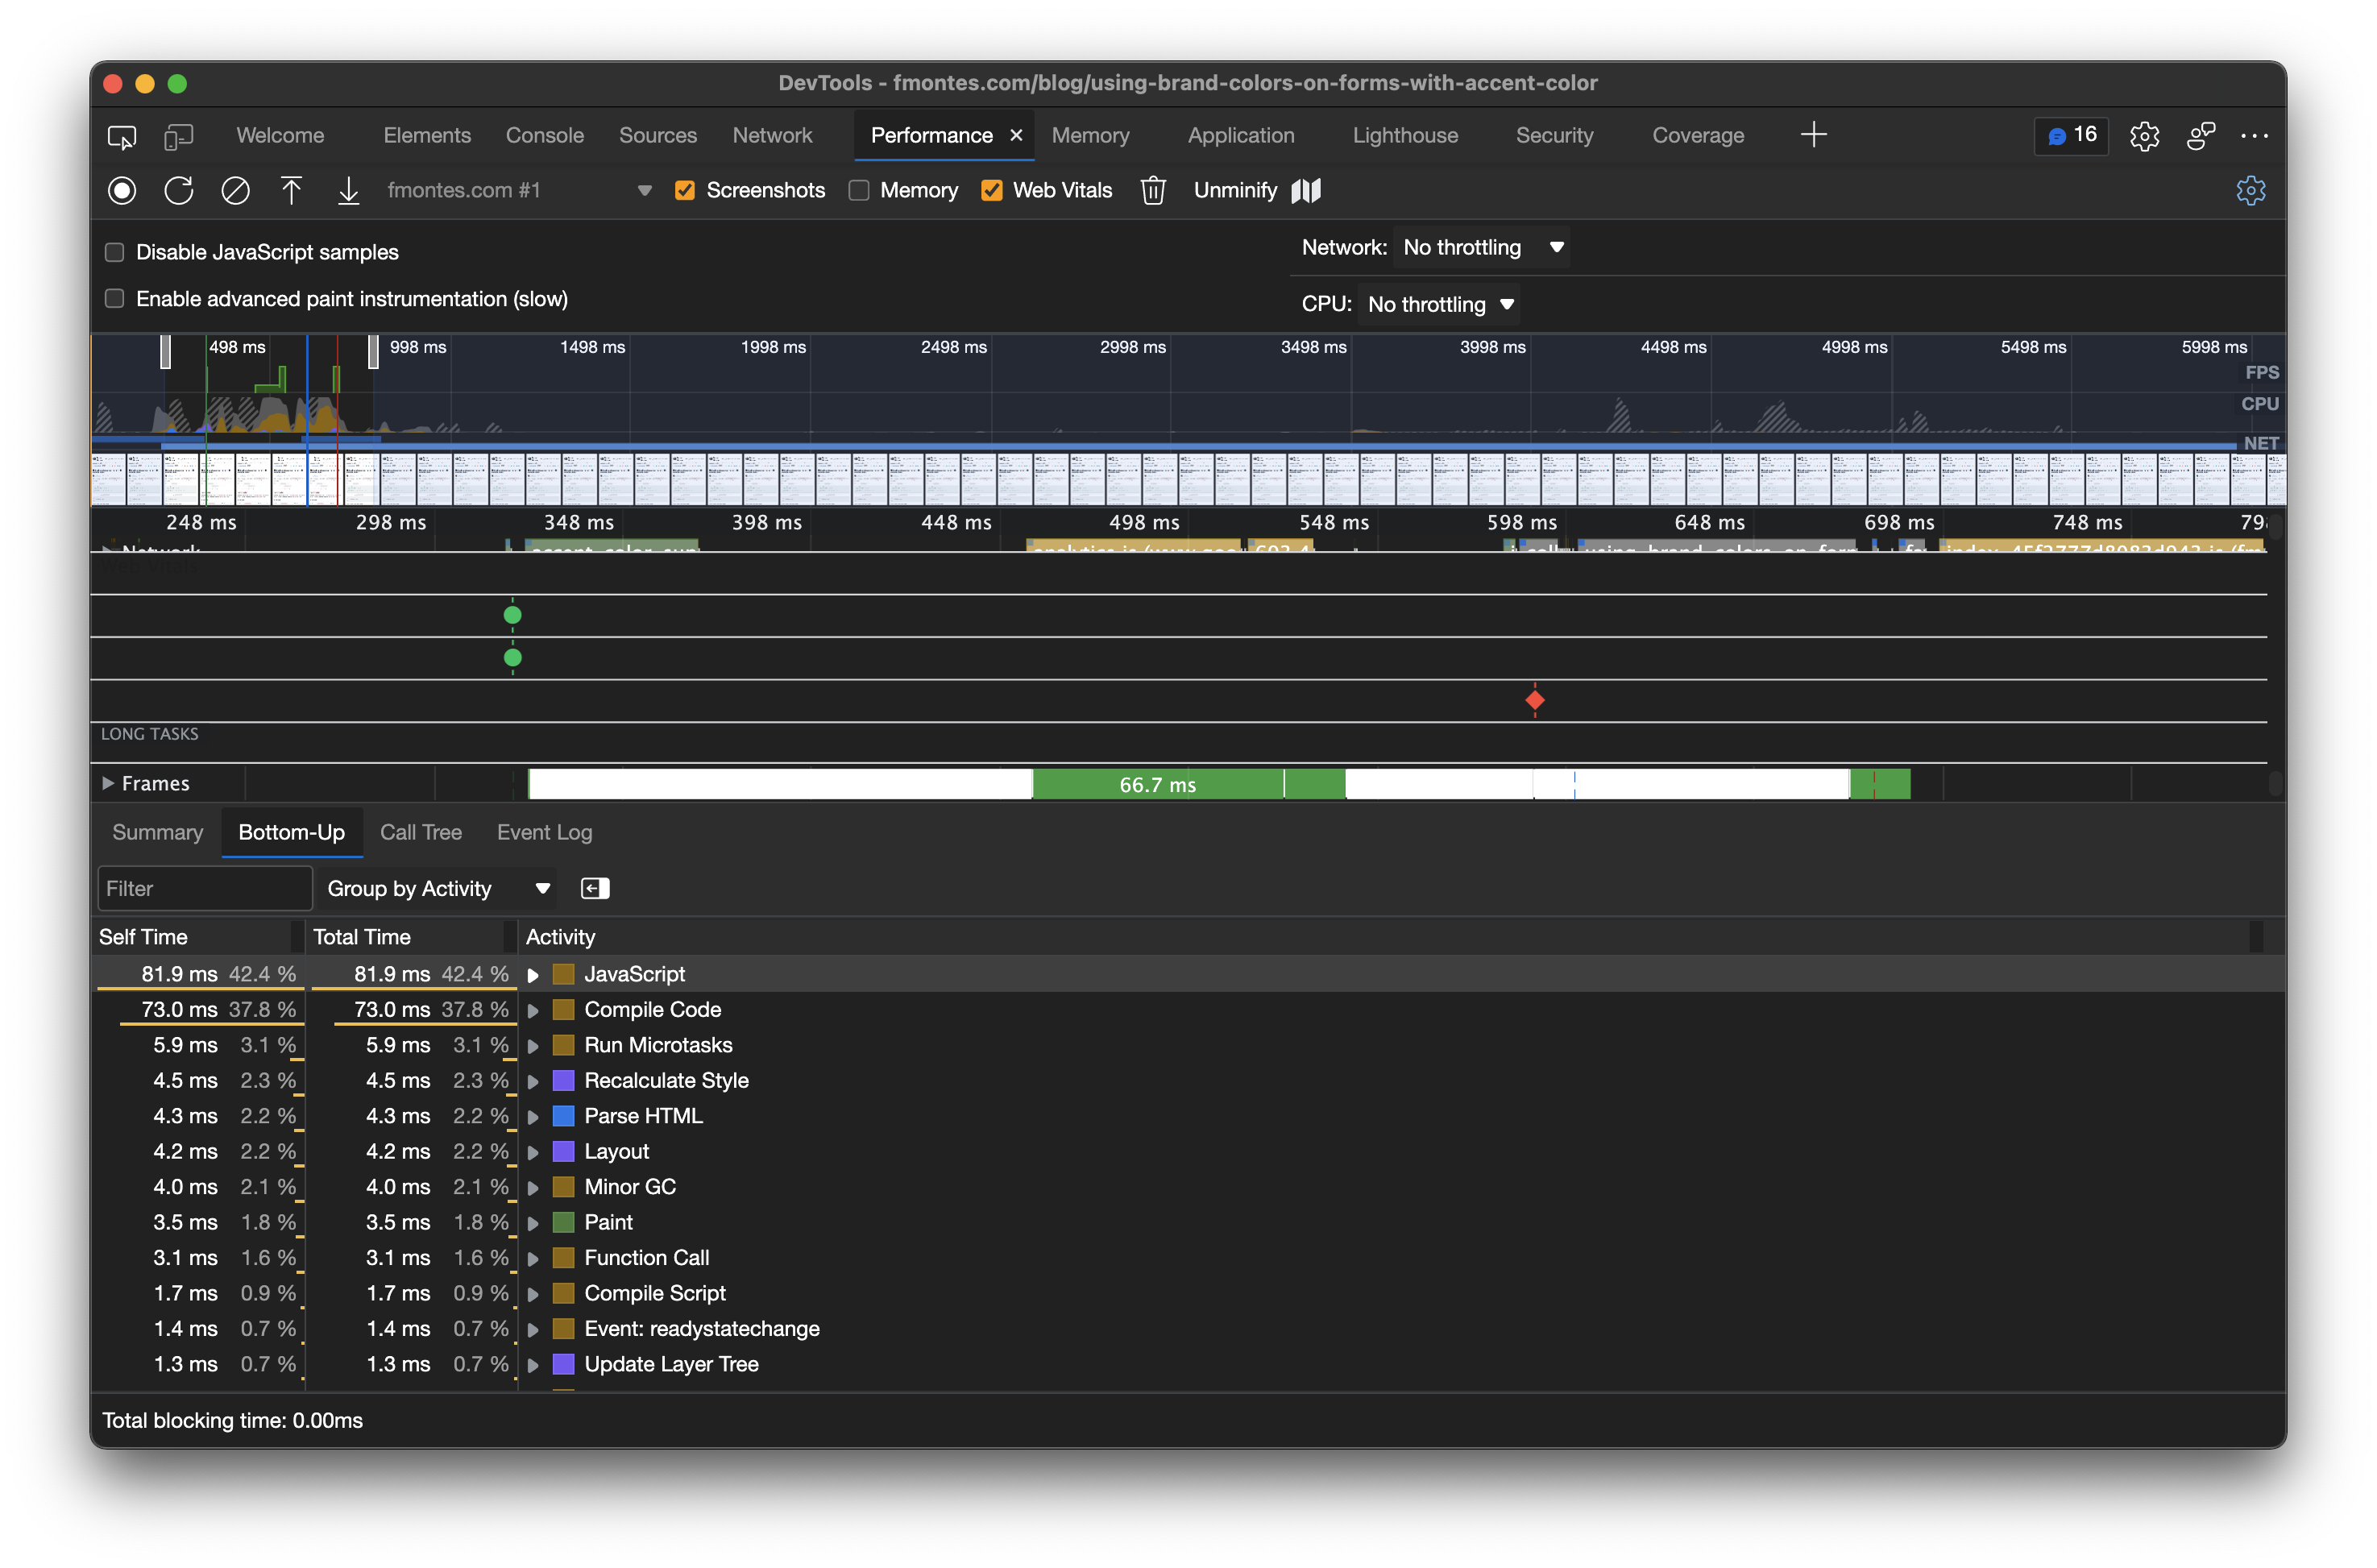
Perfect, I no longer have Long Tasks during loading, definitely react-syntax-highlighter was the culprit of the slowness of the page.
Conclusion
Improving the page load time of my blog posts is important, first it is important for SEO, but also your users will appreciate it.
The first thing we have to do is to measure and identify the culprits. With Google Page Insights I was able to determine the problem and I could see that it is in JavaScript. With the Web Inspector Performance tab I was able to identify what seems to be the culprit library and replace it.